Background
This project about “added sugar” was completed in Fall 2017 for my thesis. I first became interested in this topic when my roommate gave up added sugar for a month and saw positive health benefits. Around this same time, I started to get headaches after consuming a significant amount of sweets. These coinciding events prompted my interest is learning more about how added sugar affects our health.
It’s worth noting I have a huge sweet tooth. In high school, I would consume a large bowl of ice cream every night. More recently, I traveled from DC to NYC just to try a dessert.
Definitions:
Added Sugar: Sugars that are either added during the processing or packaging of foods.
Source: FDA
Natural Sugar: Sugars that occur naturally in foods such as fruit, vegetables, milk, and grains.
Source: AHA
The Problem:
The average American consumes 22 teaspoons of added sugar a day. The American Heart Association’s recommended amount per day is 6 teaspoons (25 grams) for women and 9 teaspoons (38 grams) for men. That means we are consuming over three times the recommended amount. A diet high in added sugar leads to the following risk factors:
- Weight gain
- Obesity
- High blood pressure
- Cardiovascular disease
- Non-alcoholic fatty liver disease
- Metabolic syndrome
- Prediabetes and diabetes
- Disturbed memory and learning
- Cavities
- Nutrient deficiencies
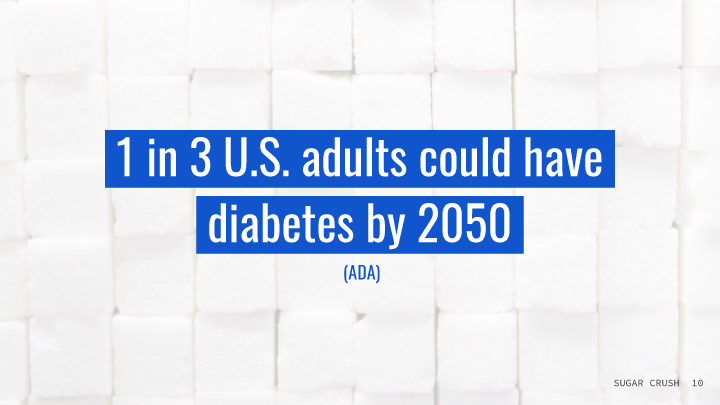
Currently, the diabetes rate for US adults is 12%. This means the rate could almost triple by 2050.
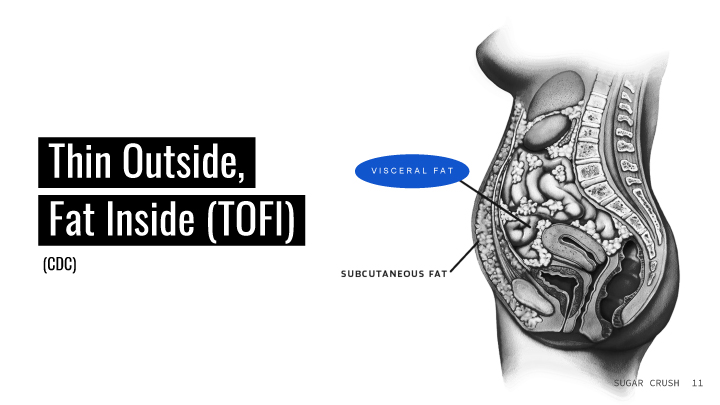
Added sugar not only affects people who struggle with their weight, but also people who appear thin. A diet high in added sugar can cause visceral fat, which is fat that clogs your vital organs. Visceral fat can lead to diseases like non-alcoholic fatty liver disease. This fat may not be noticeable on someone’s outer appearance, which is why this health issue may go undetected. Thus, visceral fat can affect people of every shape and size.
How is sugar processed?
Having a diet high in added sugar causes your blood sugar to spike and crash at extreme levels. When your blood sugar crashes, your body looses energy and is looking for a source to replenish it. This can cause you to feel hungry and potentially consume more sugar. Foods containing natural sugars are usually accompanied by fiber. Fiber helps slow down the absorption of sugar in the body and avoid sugar crashes.
Federal Nutrition Label
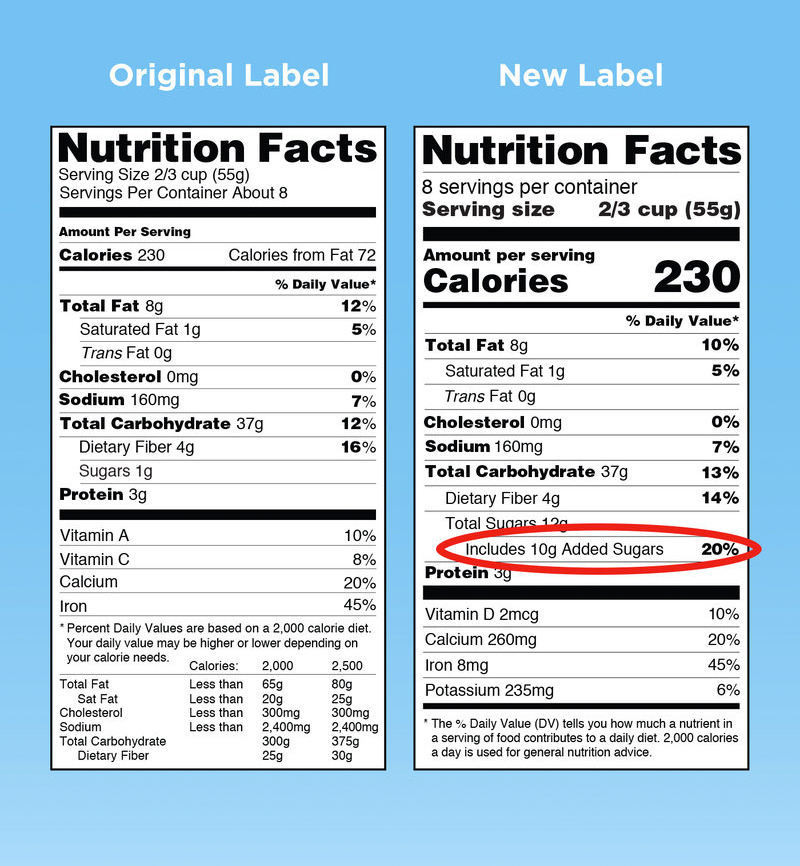
The FDA originally mandated that the food industry must include “Added Sugars” to the food label, specifying grams and percentage daily value, by July 2018. That deadline is now being pushed to January 2020 to give the food industry more time to implement this change. Currently, there is no way to tell how much sugar is natural versus added on the nutrition label, since it only states “Total Sugars”.
A Snippet of Sugar History
President Eisenhower had a heart attack in 1955 and later died of heart disease. The heart attack of a prominent public figure surfaced the need for more research on heart disease, specifically discovering its cause.
Key Researchers:
- John Yudkin concluded sugar was the culprit
- Ancel Keys concluded fat was the culprit
The Sugar Research Foundation, associated with the Sugar Association, sponsored research at Harvard on sugar, fat, and heart disease. The study concluded consuming a diet rich in fat was a risk factor for heart disease and the findings were published in the New England Journal of Medicine (1967).
The Result: Dietary Guidelines = Low Fat Diet
This led to ads promoting the benefits of sugar:
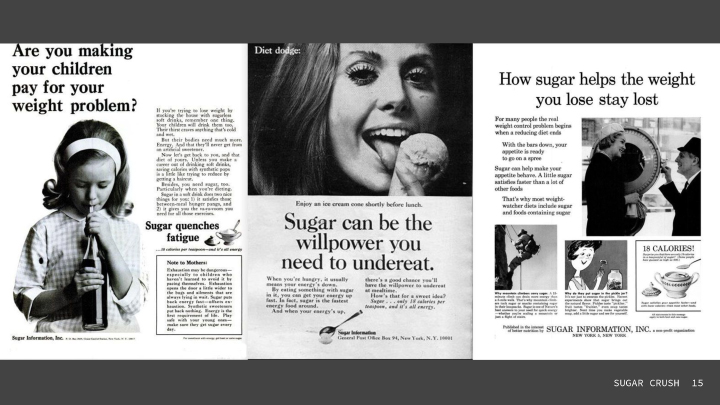
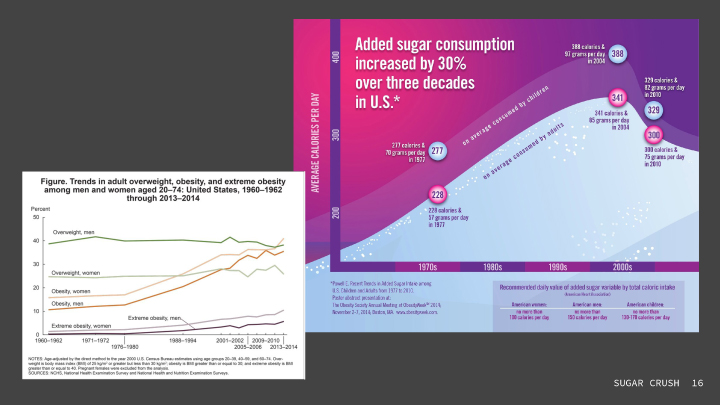
It also led to the low fat diet craze. As the food industry stripped food of it’s fat to meet the demand, sugar was introduced to make it taste better. You can see below as sugar consumption was rising in the US and people were advised to cut fats, the obesity rate rose. The dip in sugar consumption in the 2000s was most likely due to people cutting soda or other sugary beverages from their diet.
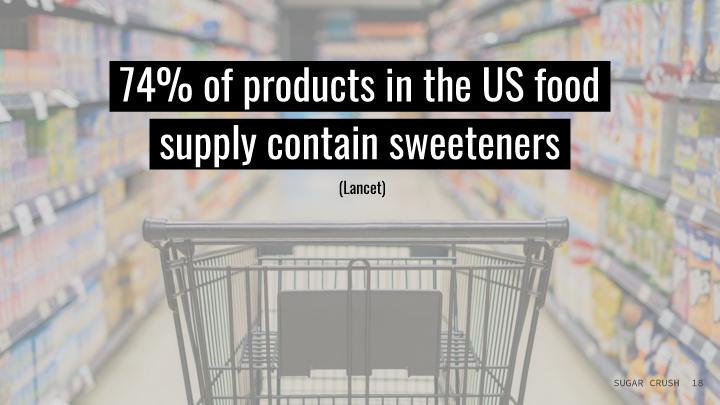
Our Food Landscape Today
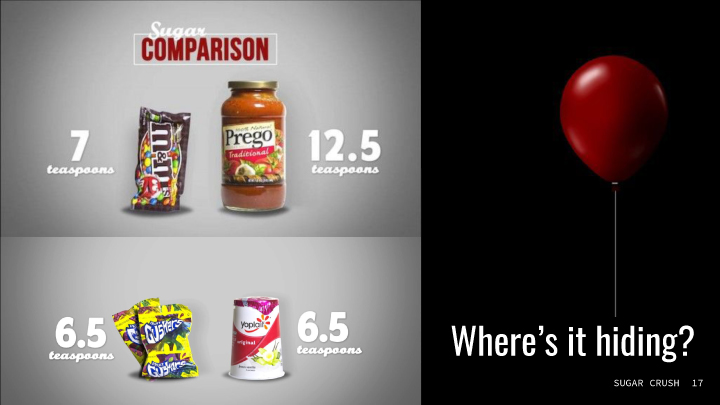
Added sugar can be hiding in products that are perceived to be healthy (e.g. tomato sauce and yogurt). However, some of these products may have more sugar than candy.
So you might get the…
The Design Problem
Solving the overconsumption of added sugars in the American daily diet.
Foreseeable Challenge:

It will be difficult to get people on board when we give sweet treats to friends, family, and romantic partners to share our thanks, love, or affection. It’s also hard to think of a holiday or celebration where dessert isn’t present.
However, as one participant mentioned:
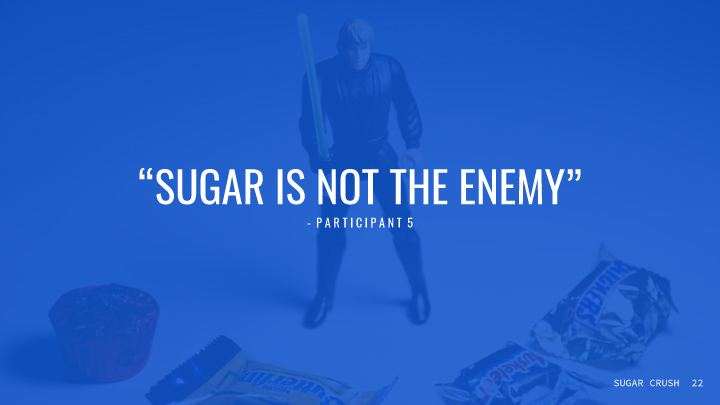
This is important to note. Setting the expectation that nobody should have added sugar for the rest of their lives is unrealistic. The goal is to find a solution that helps people reduce their consumption of added sugar and bring them closer to the recommended level.
Stakeholders & Target
Potential Stakeholders
American Heart Association and FDA
Value to Them:
- Increase in public awareness about added sugars
- Decrease in avg. consumption
- Decrease in death/illnesses
- Decrease costs for heart disease
- US spends $200 billion/year (CDC)
- Increase likability
Target
American Millennials
- Age 25-35 (Born: 1982-1992)
- Tech Savvy
- Largest adult generation (2017)
- Largest generation in labor force (2017)
They are at the point in their life where they are making their own food choices and shaping other generations’ eating habits (e.g. having kids or taking care of older generations).
Value to Them:
- Information about added sugar from reliable sources
- Added sugar tracking
- Added sugar transparency when deciding on food choices
- Natural sugar suggestions
- Improvements in health or preventive care
Expert Interview
Melanie Nupp, Functional Nutritionist
Key Takeaways:
- It takes ~2 weeks for sweet cravings to go away
- Help people adjust their diet by providing:
- Good tasting alternatives
- Personalized diet plans
- Tips (e.g. Don’t eat sugar first thing in the morning because you’ll more likely crave it later in the day.)
- Clients who cut refined sugar saw positive results
- Decreased weight
- Decreased anxiety
- Decreased panic attacks
- Decreased racing heart
- Increased energy and focus
User Interviews
Participants
- 5 total
- Ages 25-35
- Most in relationships or married
- One had a child
- Most used personal device = Cell Phone
- Most Popular Fitness App = MyFitnessPal
Findings
I asked participants what healthy foods they consumed versus craved:
- Healthy foods consumed: Fruits, veggies, meats, yogurt, dates, eggs
- Healthy foods craved: Yogurt, eggs, fruits, dates, figs, meats
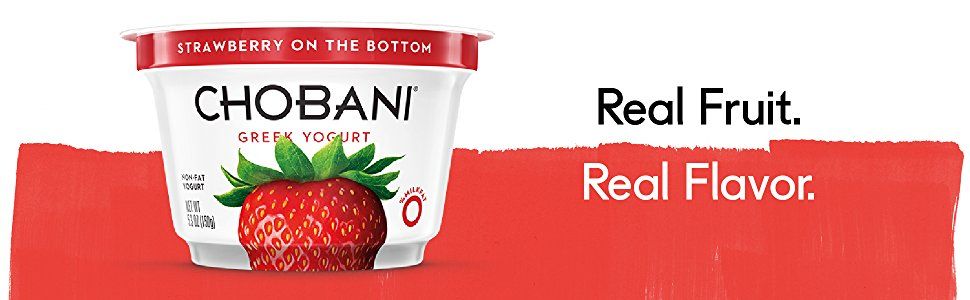
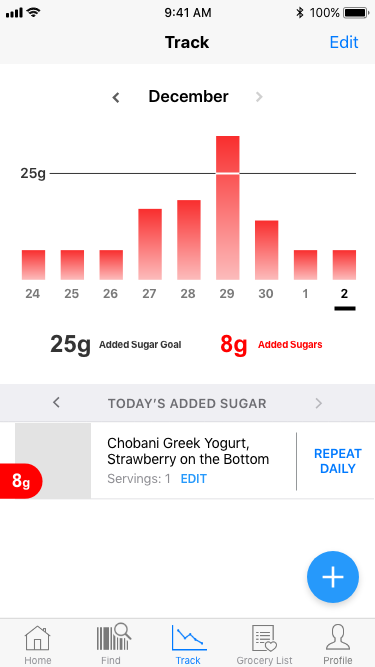
It was interesting to find that yogurt popped up in both categories and most participants considered their diet to be healthy. One participant mentioned having Chobani Strawberry on the Bottom Yogurt. This yogurt has 8.6g of added sugar for the entire serving.
I asked the same question for unhealthy foods:
- Unhealthy foods consumed: Restaurant food, freezer meals, pizza, soda, baked goods, icies, fast food, Chinese food
- Unhealthy foods craved: Pizza, chocolate, baked goods, candy, ice cream, milkshakes, fried foods, soda, juice, beer
For this question, everyone referred to foods that have a significant amount of fat and/or sugar in them.
All participants eat out
- Everyday to once every other week
Eating Influences:
- People close to them
- Convenience and price
- Ingredients and nutrition facts
All participants changed their diet recently, either positively or negatively
Reasons: Weight loss, Getting back into shape, Health concerns, A bet, and Convenience
Participants seemed to have polar opposite reactions when it comes to sugar.
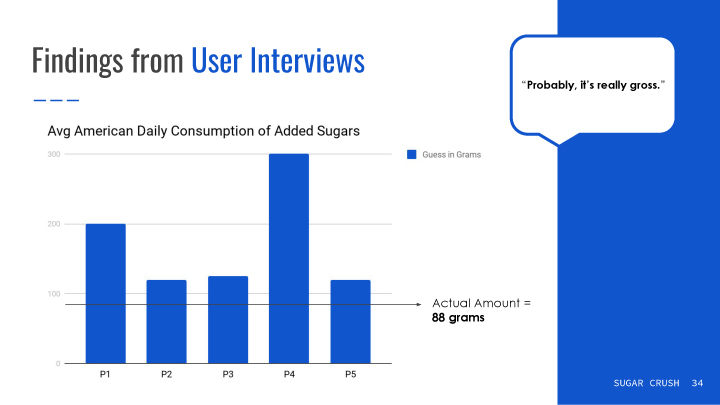
Note, most participants guessed over the actual amount.
Key Takeaways:
- Have a love/hate relationship with sugar
- Perceive Americans eat a lot of sugar
- Change diet mainly for weight, fitness, & health reasons
- Are influenced by family members’ and friends’ diets
- Purchase food that is convenient
- Use mobile apps for fitness, education, diets, & reminders
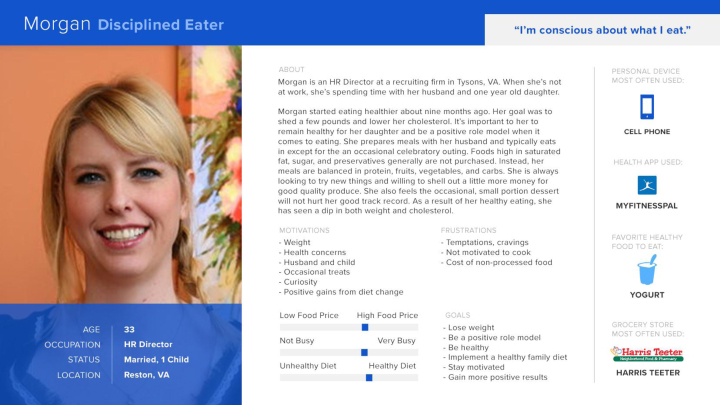
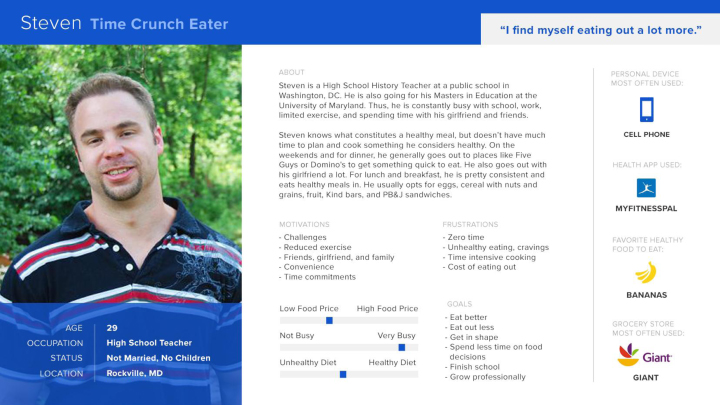
Personas
Competitive Analysis
I conducted a competitive analysis on digital applications that focus on the amount of sugar in food.
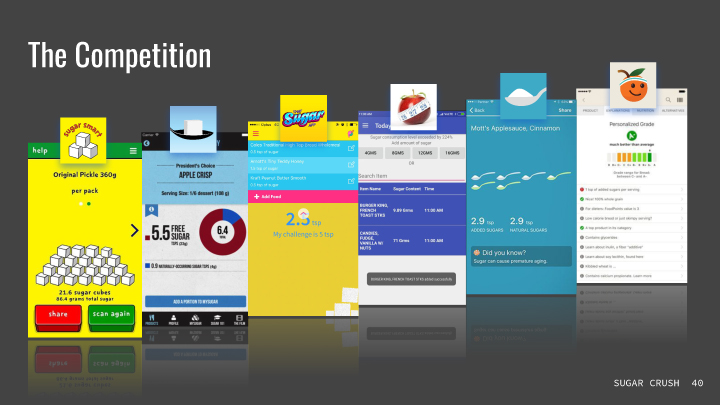
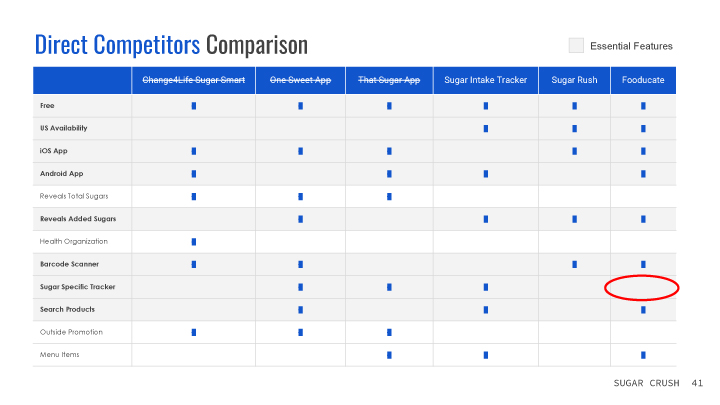
When looking at all of the competition’s features, I created the chart above to compare them. I pinpointed the essential features in gray based on my target’s needs and the competitor with the most essential features was still missing a sugar tracker feature. Note: I eliminated the first three as competitors, since they don’t reach the US market.
The Solution
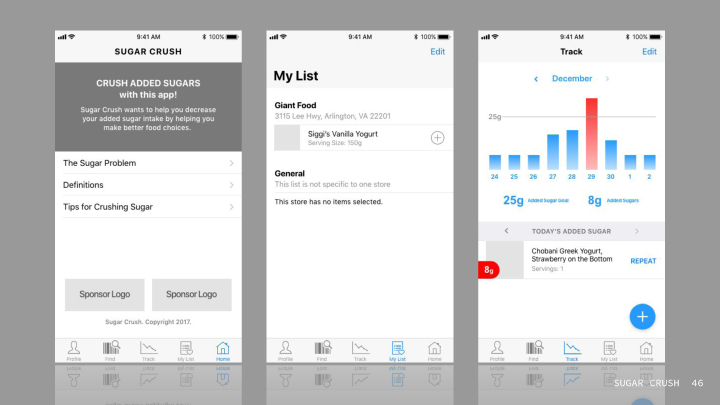
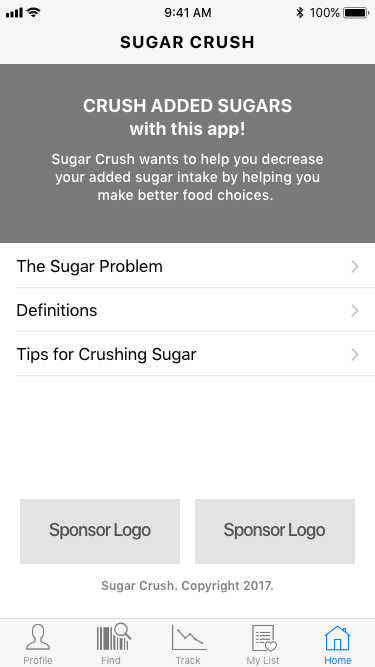
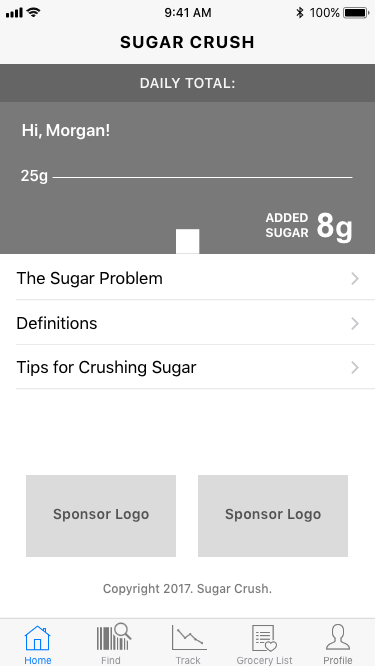
Sugar Crush Mobile App
Includes all the Essential Features and….
- Filters healthy alternative suggestions by grocery store
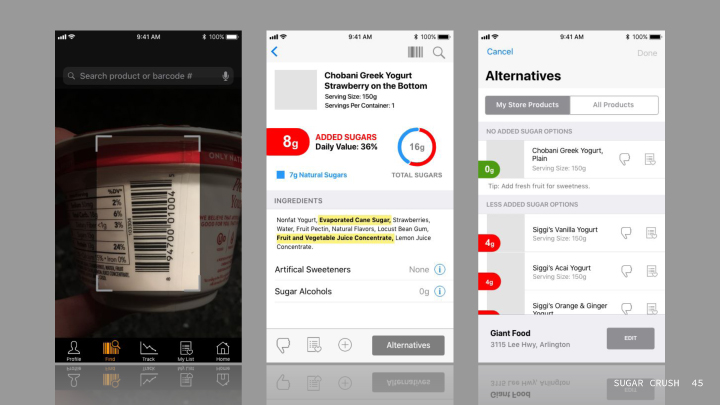
Satisfies: Making food choices convenient - Provides Extra Content: Ingredients, % Daily Value, Artificial Sweeteners, Sugar Alcohols
Satisfies: Informing the public about what is in their food while helping with sweet cravings
The Design
Medium fidelity screens were created in Adobe XD. For this project, the app was designed for an IOS platform. Ideally, this would be available on all platforms.
Key Screens:
The Prototype
The prototype was built in Invision.
User Testing
User testing was conducted both in person and remotely. Remote testing was conducted through Google Hangouts. Quicktime was used to record the audio and screen clicks for all sessions. Each session took around 25 minutes to complete.
Script Format
- Demographic & Technology Questions
- Scenarios and Tasks
- Impression Questions
The Setup
Whether remote or in person, the participants were able to see me throughout the session. I only recorded the participants’ audio and screen. This allowed me to see their clicks and movement through the app.
Main Goals
- Identify preferable search methods
- Determine if information can easily be accessed
- Determine if the application’s icons and labels are universally understood
- Confirm if the information architecture aligns with users’ mental models
- Observe any areas of frustration when performing tasks
- Determine if the app is of interest to users
Participants
- 6 participants (Ages 25-35)
- 1 participant has a child
- Half were in relationships
or married - Personal device most used = cell phone
Participants’ Favorite Features of the Sugar Crush App:
- My List – a customized grocery list of products low in added sugar that can be found at a local grocery store
- Barcode Scanner – a feature that scans the barcode of a food product to check the amount of added sugar it may contain
- Alternatives – product suggestions at a local grocery store that are lower in added sugar based on a product searched or scanned
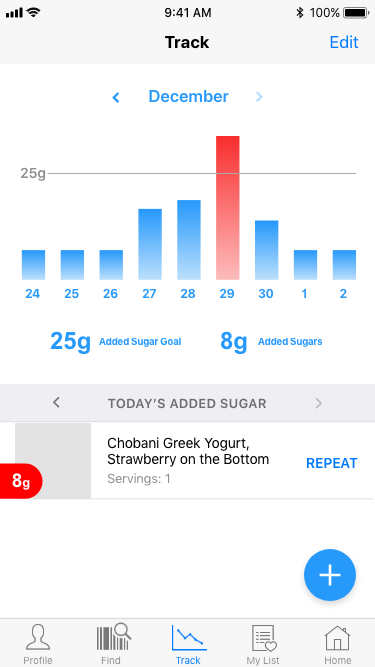
- Track – a tool tracking added sugar consumption
Issues and Recommendations
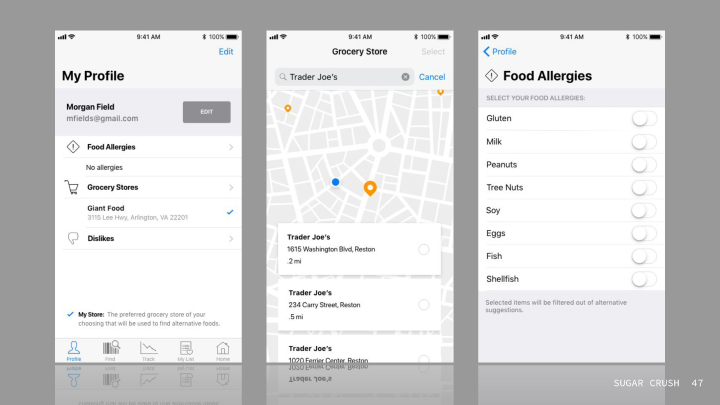
Issue 1: Adding a Grocery Store
The option to add a grocery store was listed under Profile, but some participants went to My List first.
Recommendation: Include an Add Store link or button on the Grocery List (formerly My List) page.
Issue 2: My List Label
When first viewing the bottom navigation, participants were unsure what content fell under My List.
Recommendation: Relabel My List to Grocery List to specify the list type and the information users should expect to find.
Issue 3: Finding Items Tracked on Previous Day
Participants clicked on the bar (of the previous day) in the chart with the expectation that the information would display below.
Recommendations: Make the bar chart clickable to access that day’s food. In addition, have a marker on the chart to know what day is currently being viewed.
Issue 4: Repeat Label
Participants thought Repeat meant adding another serving of the line item. The button was intended, if selected, to repeat that line item on a daily basis.
Recommendations: Have an Edit button next to servings on the line item. Change Repeat to Repeat Daily.
Issue 5: Accessing My List
Participants struggled navigating to the My List page from the Alternatives and Product pages. The participant had to take several steps to make their way back to the main menu on the Scan page.
Recommendation: Add a Grocery List (formerly My List) link on the Alternatives page.
Issue 6: Adjusting the Added Sugar Goal
Participants thought the Added Sugar Goal could be changed by dragging the goal line.
Recommendation: Make the goal line draggable and add a prompt to make sure the change was intended.
>
Additional Recommendations
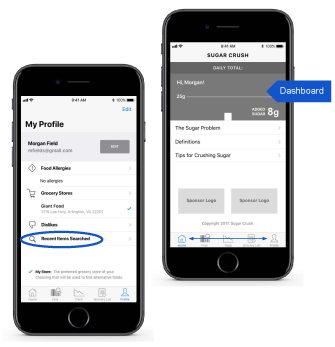
- Make Home more personalized with a dashboard
- Switch Profile & Home locations in navigation
- Add “Recent Items Searched” in Profile
Future Recommendations
Users can:
- Share accounts or information
- Add new items to the database
- Integrate added sugar tracking into other health apps
Additional features:
- Include restaurant food in Search
- Show natural sugars on Track page
- Provide Glycemic Load information